Best Practices for Monitoring TiDB Using Grafana
When you deploy a TiDB cluster using TiUP and have added Grafana and Prometheus in the topology configuration, a set of Grafana + Prometheus monitoring platform is deployed simultaneously to collect and display metrics for various components and machines in the TiDB cluster. This document describes best practices for monitoring TiDB using Grafana. It aims to help you use metrics to analyze the status of the TiDB cluster and diagnose problems.
Monitoring architecture
Prometheus is a time series database with a multi-dimensional data model and a flexible query language. Grafana is an open source monitoring system for analyzing and visualizing metrics.
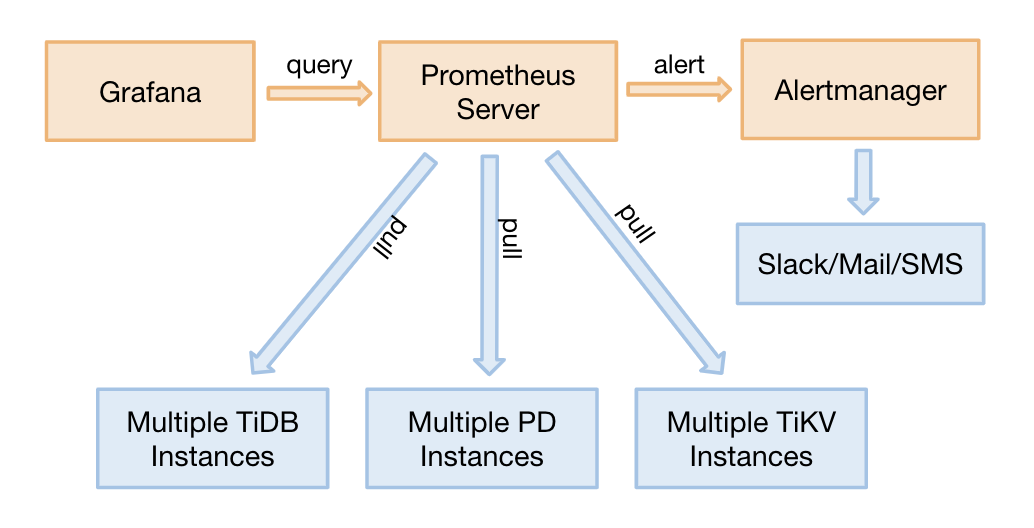
For TiDB 2.1.3 or later versions, TiDB monitoring supports the pull method. It is a good adjustment with the following benefits:
- There is no need to restart the entire TiDB cluster if you need to migrate Prometheus. Before adjustment, migrating Prometheus requires restarting the entire cluster because the target address needs to be updated.
- You can deploy 2 separate sets of Grafana + Prometheus monitoring platforms (not highly available) to prevent a single point of monitoring.
- The Pushgateway which might become a single point of failure is removed.
Source and display of monitoring data
The three core components of TiDB (TiDB server, TiKV server and PD server) obtain metrics through the HTTP interface. These metrics are collected from the program code, and the ports are as follows:
| Component | Port |
|---|---|
| TiDB server | 10080 |
| TiKV server | 20181 |
| PD server | 2379 |
Execute the following command to check the QPS of a SQL statement through the HTTP interface. Take the TiDB server as an example:
curl http://__tidb_ip__:10080/metrics |grep tidb_executor_statement_total
# Check the real-time QPS of different types of SQL statements. The numbers below are the cumulative values of counter type (scientific notation).
tidb_executor_statement_total{type="Delete"} 520197
tidb_executor_statement_total{type="Explain"} 1
tidb_executor_statement_total{type="Insert"} 7.20799402e+08
tidb_executor_statement_total{type="Select"} 2.64983586e+08
tidb_executor_statement_total{type="Set"} 2.399075e+06
tidb_executor_statement_total{type="Show"} 500531
tidb_executor_statement_total{type="Use"} 466016
The data above is stored in Prometheus and displayed on Grafana. Right-click the panel and then click the Edit button (or directly press the E key) shown in the following figure:

After clicking the Edit button, you can see the query expression with the tidb_executor_statement_total metric name on the Metrics tab. The meanings of some items on the panel are as follows:
rate[1m]: The growth rate in one minute. It can only be used for the data of counter type.sum: The sum of values.by type: The summed data is grouped by type in the original metric value.Legend format: The format of the metric name.Resolution: The step width defaults to 15 seconds. Resolution means whether to generate one data point for multiple pixels.
The query expression on the Metrics tab is as follows:
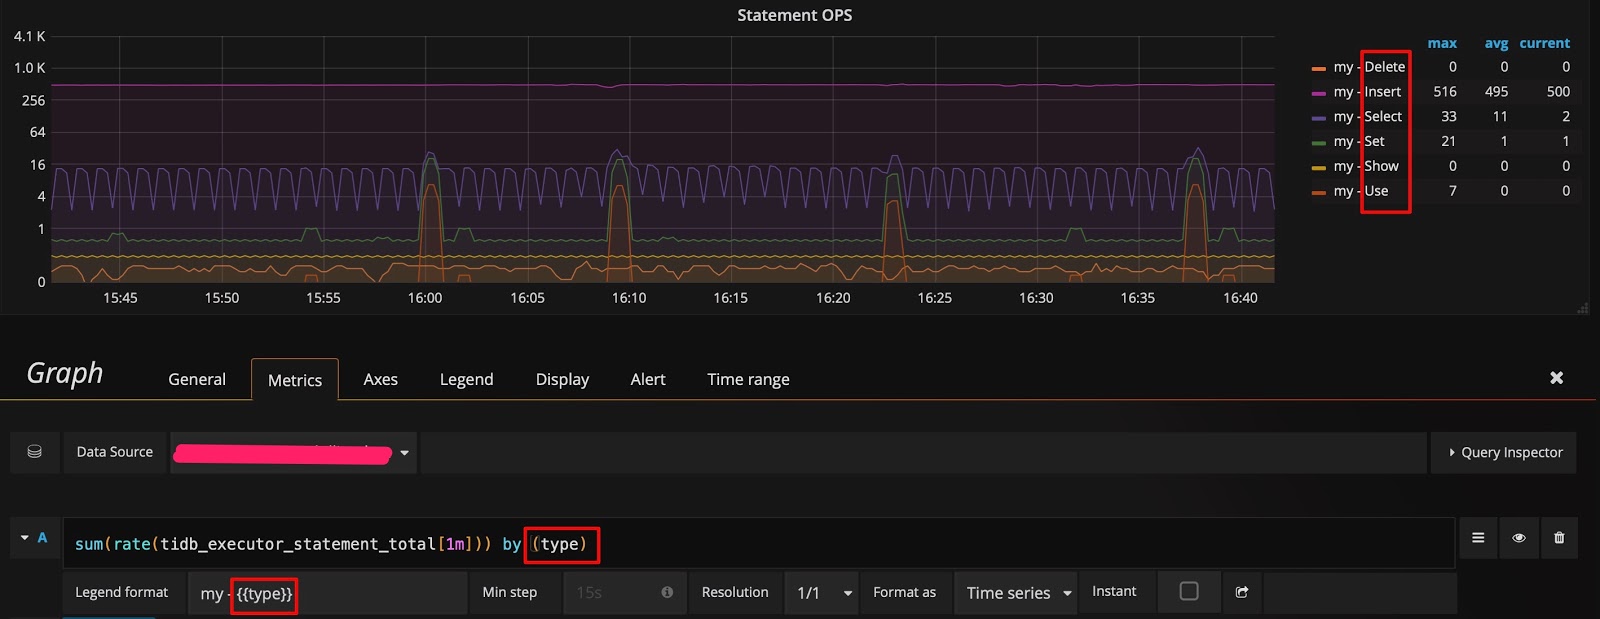
Prometheus supports many query expressions and functions. For more details, refer to Prometheus official website.
Grafana tips
This section introduces seven tips for efficiently using Grafana to monitor and analyze the metrics of TiDB.
Tip 1: Check all dimensions and edit the query expression
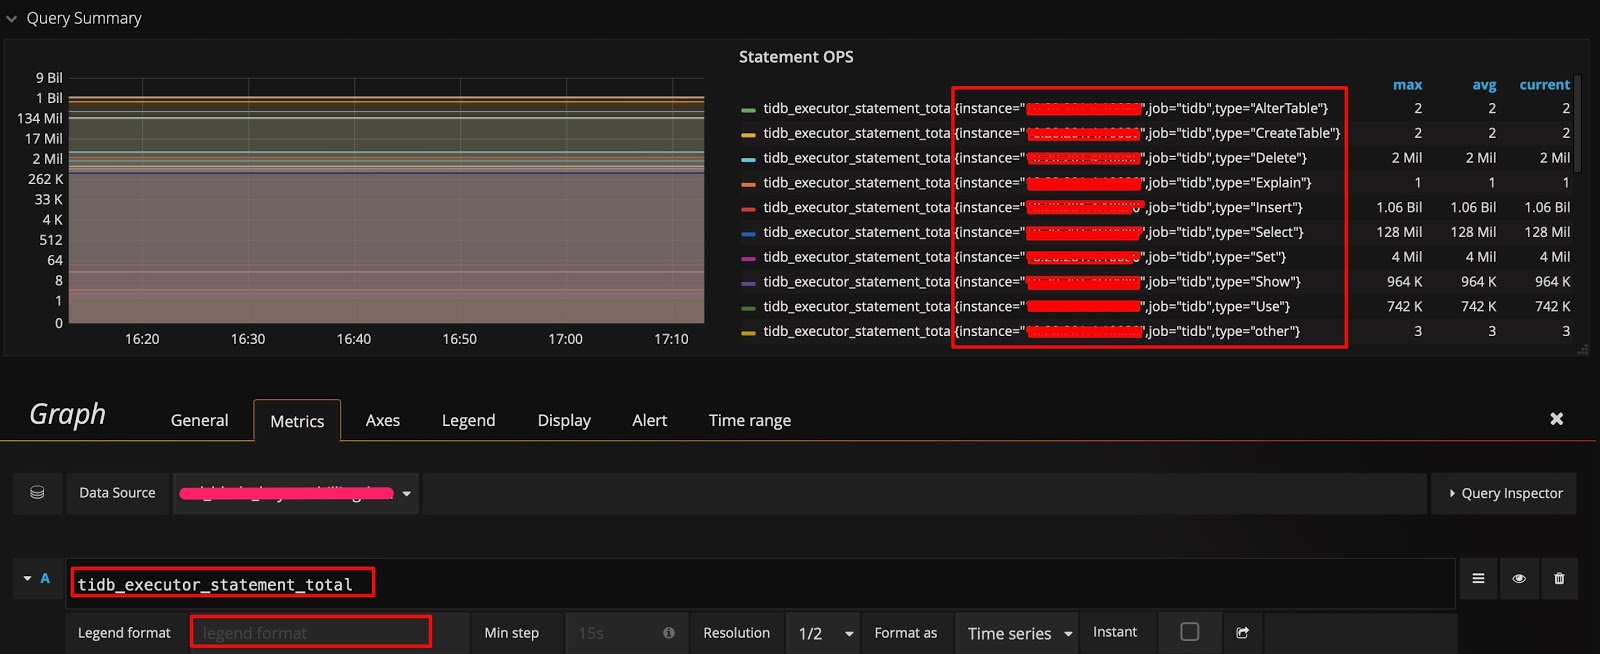
In the example shown in the source and display of monitoring data section, the data is grouped by type. If you want to know whether you can group by other dimensions and quickly check which dimensions are available, you can use the following method: Only keep the metric name on the query expression, no calculation, and leave the Legend format field blank. In this way, the original metrics are displayed. For example, the following figure shows that there are three dimensions (instance, job and type):
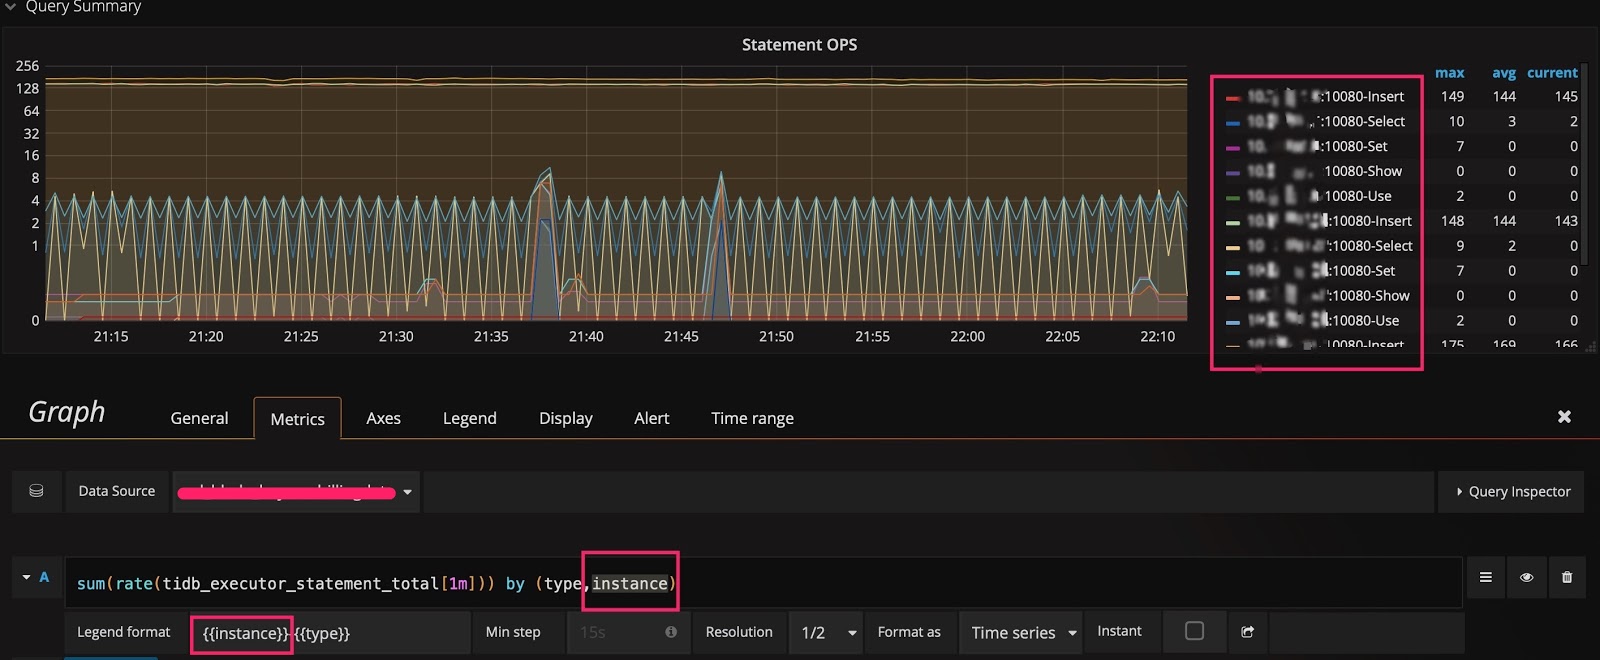
Then you can modify the query expression by adding the instance dimension after type, and adding {{instance}} to the Legend format field. In this way, you can check the QPS of different types of SQL statements that are executed on each TiDB server:
Tip 2: Switch the scale of the Y-axis
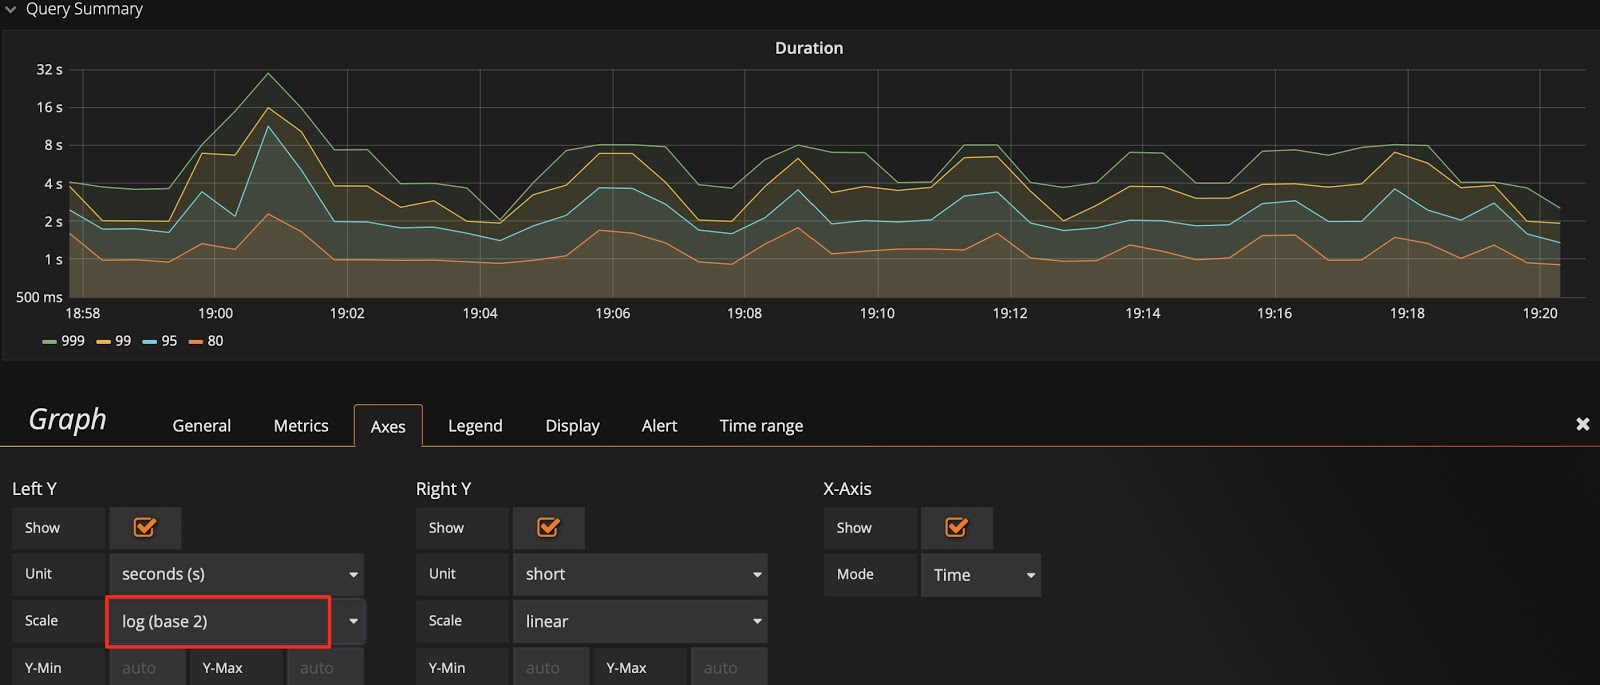
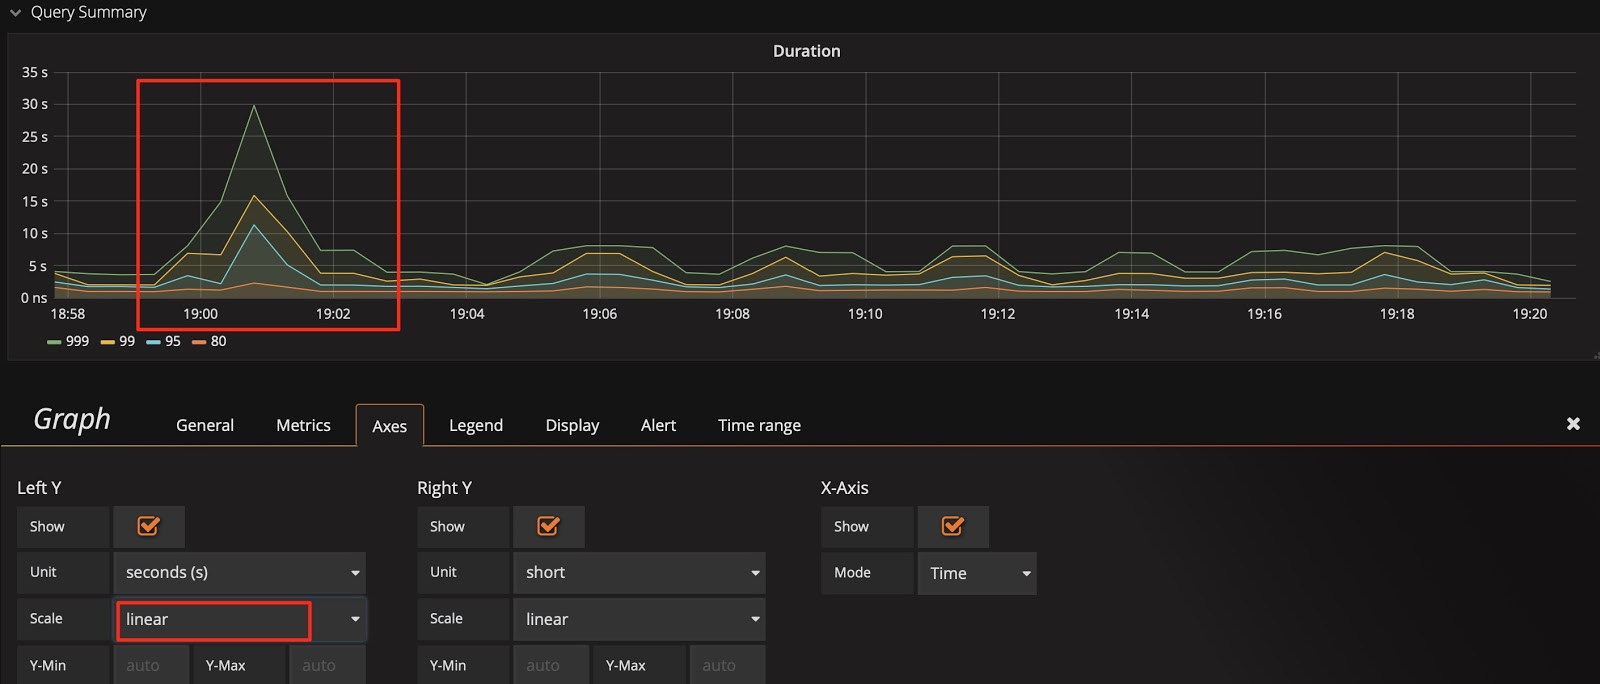
Take Query Duration as an example, the Y-axis defaults to be on a binary logarithmic scale (log2n), which narrows the gap in display. To amplify changes, you can switch it to a linear scale. Comparing the following two figures, you can easily notice the difference in display, and locate the time when an SQL statement runs slowly.
Of course, a linear scale is not suitable for all situations. For example, if you observe the performance trend for the duration of a month, there might be noises with a linear scale, making it hard to observe.
The Y-axis uses a binary logarithmic scale by default:
Switch the Y-axis to a linear scale:
Tip 3: Modify the baseline of the Y-axis to amplify changes
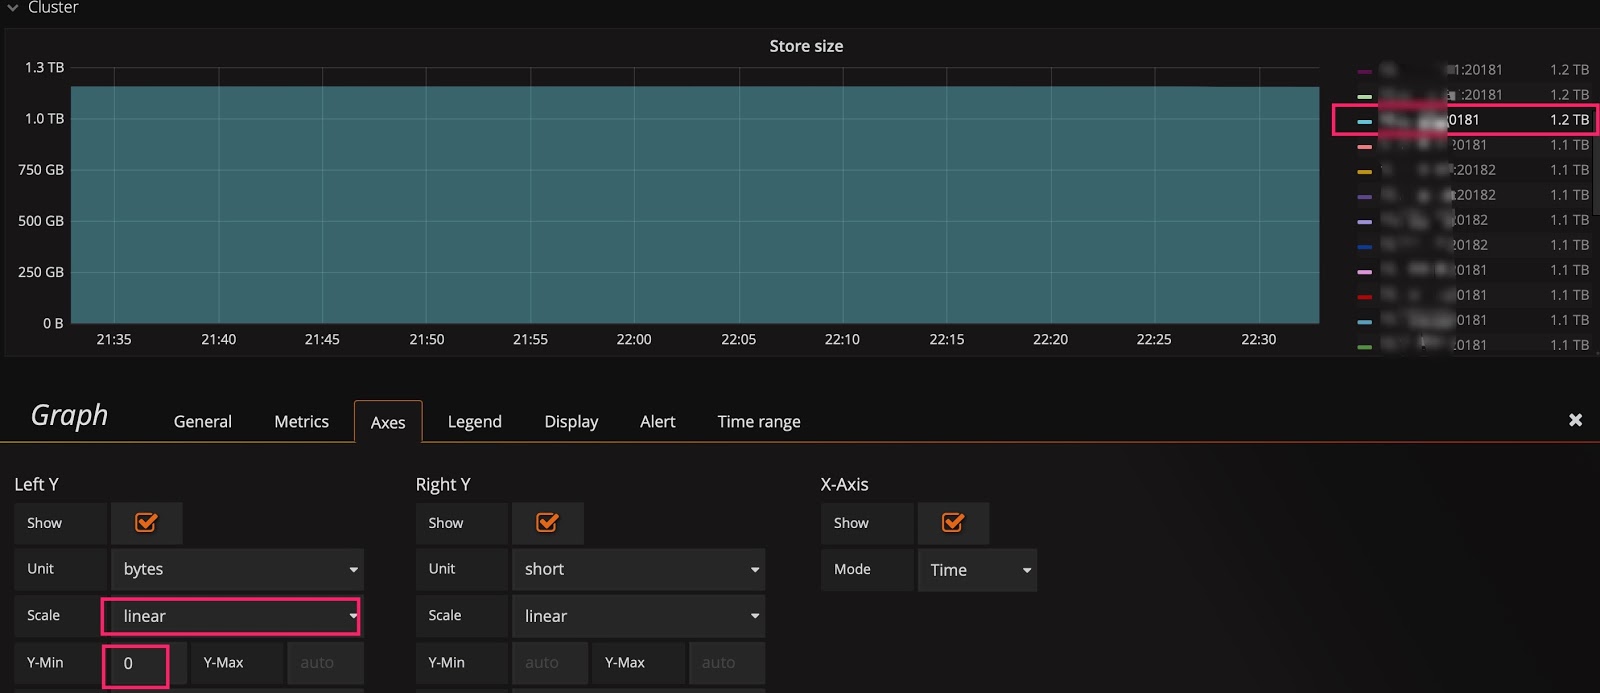
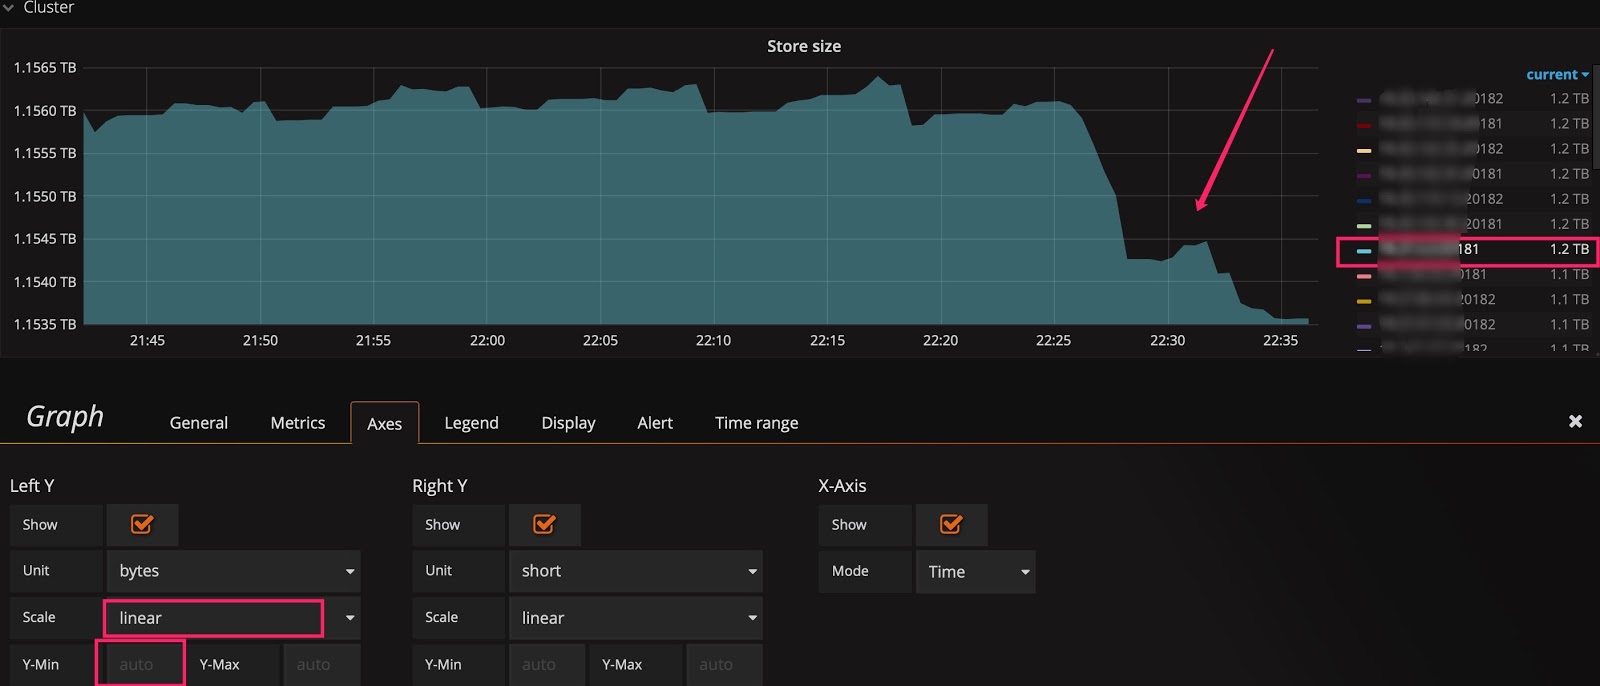
You might still cannot see the trend after switching to the linear scale. For example, in the following figure, you want to observe the real-time change of Store size after scaling the cluster, but due to the large baseline, small changes are not visible. In this situation, you can modify the baseline of the Y-axis from 0 to auto to zoom in the upper part. Check the two figures below, you can see data migration begins.
The baseline defaults to 0:
Change the baseline to auto:
Tip 4: Use Shared crosshair or Tooltip
In the Settings panel, there is a Graph Tooltip panel option which defaults to Default.

You can use Shared crosshair and Shared Tooltip respectively to test the effect as shown in the following figures. Then, the scales are displayed in linkage, which is convenient to confirm the correlation of two metrics when diagnosing problems.
Set the graphic presentation tool to Shared crosshair:

Set the graphical presentation tool to Shared Tooltip:

Tip 5: Enter IP address:port number to check the metrics in history
PD's dashboard only shows the metrics of the current leader. If you want to check the status of a PD leader in history and it no longer exists in the drop-down list of the instance field, you can manually enter IP address:2379 to check the data of the leader.

Tip 6: Use the Avg function
Generally, only Max and Current functions are available in the legend by default. When the metrics fluctuate greatly, you can add other summary functions such as the Avg function to the legend to check the overall trend for the duration of time.
Add summary functions such as the Avg function:
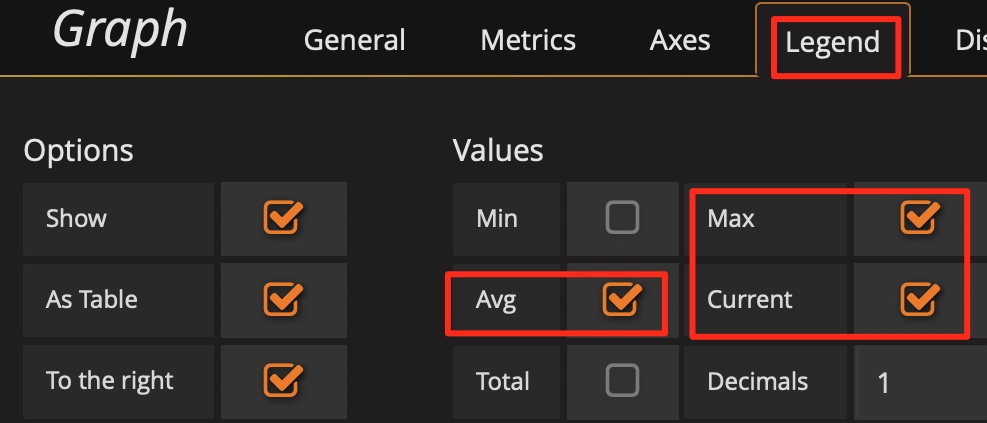
Then check the overall trend:

Tip 7: Use the API of Prometheus to obtain the result of query expressions
Grafana obtains data through the API of Prometheus and you can use this API to obtain information as well. In addition, it also has the following usages:
- Automatically obtains information such as the cluster size and status.
- Makes minor changes to the expression to provide information for the report, such as counting the total amount of QPS per day, the peak value of QPS per day, and the response time per day.
- Performs regular health inspection on the important metrics.
The API of Prometheus is shown as follows:

curl -u user:pass 'http://__grafana_ip__:3000/api/datasources/proxy/1/api/v1/query_range?query=sum(tikv_engine_size_bytes%7Binstancexxxxxxxxx20181%22%7D)%20by%20(instance)&start=1565879269&end=1565882869&step=30' |python -m json.tool
{
    "data": {
        "result": [
            {
                "metric": {
                    "instance": "xxxxxxxxxx:20181"
                },
                "values": [
                    [
                        1565879269,
                        "1006046235280"
                    ],
                    [
                        1565879299,
                        "1006057877794"
                    ],
                    [
                        1565879329,
                        "1006021550039"
                    ],
                    [
                        1565879359,
                        "1006021550039"
                    ],
                    [
                        1565882869,
                        "1006132630123"
                    ]
                ]
            }
        ],
        "resultType": "matrix"
    },
    "status": "success"
}
Summary
The Grafana + Prometheus monitoring platform is a very powerful tool. Making good use of it can improve efficiency, saving you a lot of time on analyzing the status of the TiDB cluster. More importantly, it can help you diagnose problems. This tool is very useful in the operation and maintenance of TiDB clusters, especially when there is a large amount of data.